What is Product-Based Planning?
Product-Based Planning is a longtime hallmark of PRINCE2. It consists of four steps:
- Write a Project Product Description, which is a high-level description of customer expectations.
- Write a Product Breakdown Structure (PBS), which is a logical hierarchy of the project’s deliverables.
- Write a Product Description (PD), which is a concise but complete verbal definition of what has to be delivered by the project.
- Create a Product Flow Diagram (PFD), which identifies the order of precedence of products and their components or constituents.
BTW, the PMI PMBoK knows something called a “Work Breakdown Structure” which comes quite close to the PBS idea, in fact, there should be a 1:1 relation between the details, i.e., for every item in the PBS there should be (at least) one task to deliver it.
How do I implement Product-Based Planning?
I implement PBP by implementing the four steps from above, where step 1 and step 3 effectively are boiling down to writing a word document. I know you can do it!
How to write a Project Product Description?
Well, write a word document. Some templates can be found on the web.
How do I do a Product Breakdown Structure?
By learning from examples. Well, here comes the example: We want to move a shed from place A to place B. What would be a good PBS?
Before we start we should define different node shapes for different classes of products (or deliverables):
- Logical groups are shown as parallelograms.
- External products (delivered not by the project but consumed by it) are shown as ellipsoids.
- Management products are not filled, all other products are filled (with non-white).
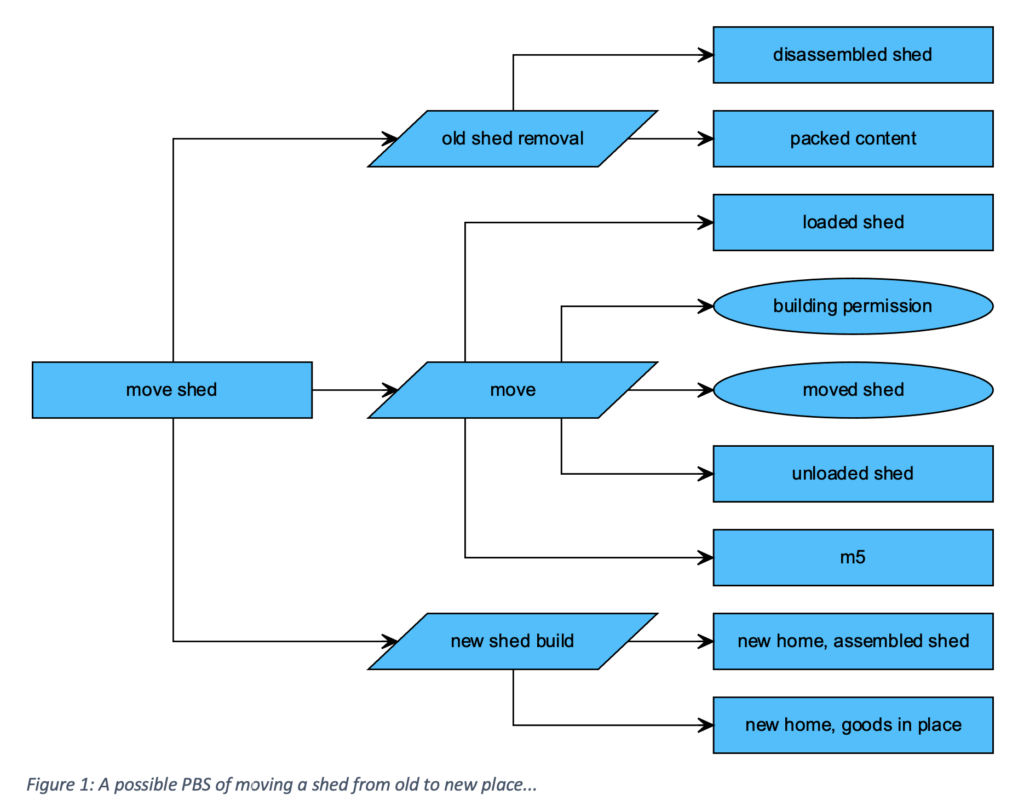
We see that our total outcome consists of three logical products groups (the parallelograms). For the sake of simplicity, we divide the complete hut into just two entities: the shed shell and its content. And we omit the management products (plans, reports, documentation, etc.)
Moving the shed is a bit more complex, since we foresee the need of a permission to build the hut at the new location, and we do not have a truck, thus an external mover will be involved. These are thus marked with an ellipse.
How on earth how did I create it? Well, I started my favorite text editor (sublime) and entered this:
digraph pbs {
    splines=ortho
    rankdir="LR"
    node [margin=0.1 fontcolor=black fontsize=12
      shape=rect style=filled
      arrowhead="vee" fontname="Arial" fixedsize=true
      width=2.5 shape="rect"
      fillcolor=deepskyblue1  ]
    edge[arrowhead="vee"]

    p [label="move shed"]
    o [label="old shed removal" shape="parallelogram"]
      o1 [label="disassembled shed"]
      o2 [label="packed content"]
    m [label="move" shape="parallelogram"]
      m1 [label="loaded shed"]
      m2 [label="building permission" shape="ellipse"]
      m3 [label="moved shed" shape="ellipse"]
      m4 [label="unloaded shed"]
    n [label="new shed build" shape="parallelogram"]
      n1 [label="new home, assembled shed"]
      n2 [label="new home, goods in place"]
    p -> {o m n}
    o -> {o1 o2}
    n -> {n1 n2}
    m -> {m1 m2 m3 m4}
}
…and pasted this into this: https://dreampuf.github.io/GraphvizOnline/ (or http://magjac.com/graphviz-visual-editor/)
In fact, the data seen above is written in a graph language called DOT (https://graphviz.org) and with this or a command line tool you can generate wonderful scalable vector graphics (SVGs), which can be viewed in any modern browser or may be imported into word.
How to write a Product Description?
Well, write a word document with a table with two columns: “product name” and “product description”, and you should be fine.
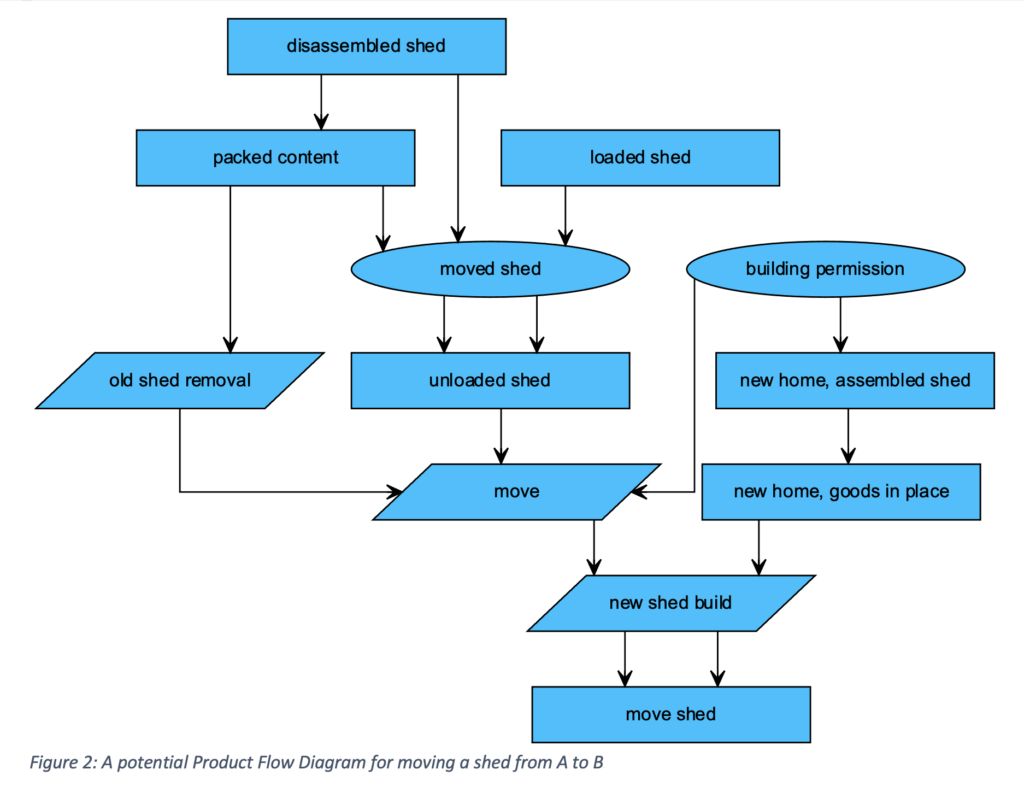
How could I write a Product Flow Diagram?
Easy:
digraph pfd {
    splines=ortho
    rankdir="TD"
    node [margin=0.1 fontcolor=black fontsize=12
      shape=rect style=filled
      arrowhead="vee" fontname="Arial" fixedsize=true
      width=2.5 shape="rect"
      fillcolor=deepskyblue1]
    edge[arrowhead="vee"]

    p [label="move shed"]
    o [label="old shed removal" shape="parallelogram"]
    o1 [label="disassembled shed"]
    o2 [label="packed content"]
    m [label="move" shape="parallelogram"]
    m1 [label="loaded shed"]
    m2 [label="building permission" shape="ellipse"]
    m3 [label="moved shed" shape="ellipse"]
    m4 [label="unloaded shed"]
    n [label="new shed build" shape="parallelogram"]
    n1 [label="new home, assembled shed"]
    n2 [label="new home, goods in place"]

    o -> m -> n -> p
    o1 -> m3 -> m4
    o2 -> m3
    o1 -> o2 -> o
    m1 -> m3 -> m4 -> m
    m2 -> m
    m2 -> n1 -> n2 -> n -> p
}
What should you learn to understand the DOT language? Here is my concise list:
- Start with PBS digraph <NAME> {}. This will generate an empty directed graph.
- Insert your products into the braces, one per line. The format is
<PRODUCT NAME> [label = “<TEXT”]. In graph theory these products are called nodes. - Insert tree relationships, e. g., product-> component 1, one per line. In graph theory these relationships are called edges. Since we have a directed graph, these edges have start and an end, marked by an arrow or the like.
- If you like to manipulate certain attributes, you either change them in the nodes, or you insert a node item to change the default behavior of all nodes. The same holds true for edges.
- RTFM.